Room-Temperature Magneto-Optics of Ferromagnetic Transition-Metal-Doped ZnO Thin Films
Magneto-optic studies of ZnO doped with transition metals Co, Mn, V, and Ti indicate a significant magnetic circular dichroism (MCD) at the ZnO band edge at room temperature, together with an associated dispersive Faraday rotation. Similar spectra occur for each dopant, which implies that the ferromagnetism is an intrinsic property of the bulk ZnO lattice. At 10 K, additional paramagnetic contributions to the MCD are observed, but above about 150 K, the magnitude of the MCD signal is dominated by the ferromag- netism and is almost temperature independent. The MCD at the ZnO band edge shows room temperature hysteretic behavior.
The search for spintronic materials that combine semiconducting and ferromagnetic properties, dilute magnetic semiconductors, is currently the most topical field in magnetism. The compounds based on the wide-gap (3.4 eV) semiconductor ZnO are especially exciting because they exhibit ferromagnetism at room temperature [1�C6], in contrast to the GaMnAs- based materials for which the highest reported Curie temperatures  are still well below 300 K.
Despite the growing body of evidence in favor of room temperature mag- netic hysteresis in doped ZnO, the nature of the ferromagnetism is hotly contested. The original interest in ZnO was prompted by the prediction that the hole exchange mechanism found in GaMnAs would produce Curie temperatures above 300 K [7]. However, it is now known that the doping is normally n-type, for which the exchange is smaller [8]. Furthermore, the measured moments are often much smaller than the theoretical values, which suggests that the magnetism might be due to an impurity phase [9,10]. It is therefore highly important to carry out careful experimental studies that can elucidate the microscopic origin of the magnetism.
In this Letter, we present a detailed study of the magneto-optical (M-O) properties of ferromagnetic ZnO, together with other experimental details. A measurement of the magnetic circular dichroism (MCD) at photon energy E gives the difference in absorption for left and right circularly po- larized light at that same energy. Hence, it provides a clear indication of the extent to which the states involved in the transition at that par- ticular energy are influenced by the magnetism. We concentrate here on the spectral region close to the band edge at  3.4 eV, since this cha- racterizes the intrinsic behavior of the ZnO lattice. The results show that the ferromagnetism at 300 K is intimately connected with the band electrons of ZnO and that the carriers are polarized. Furthermore, since ZnO is transparent in the blue or ultraviolet range, the large Faraday rotations that we observe around 3 eV are potentially useful for appli- cations in M-O processing.
The  samples studied here (M =transition metal) were grown as thin films by pulsed laser depositionon sapphire (0001) substrates. Co, Mn, V, and Ti were used as the dopants with concentrations up to 5%. An undoped ZnO film was also grown for reference. SQUID hysteresis loops of the doped films all show room temperature ferromagnetism, as has been observed previously [1,2,4]. Films with thicknesses in the range 200�C500 nm were selected to permit partial transmission for light above the band gap. We agree with previous workers [2,6] that the highest magnetic mo- ments are obtained in samples that are grown with an oxygen deficiency at low O2 pressures, thus resulting in Zn interstitials or oxygen va- cancies. However, different growth conditions are required to optimize the optical properties, and all the measurements presented here were made on films grown at 10 m Torr of
  . At this pressure, the sharpest spectral features were obtained [4], but the moment is smaller than those grown at lower
  pressure. The experimental values of the moment per transi- tion metal ion (and the theoretical maxima) are Co, 0.45
 (3
(3 ); Mn, 0.1
 (5
(5 ); Ti, 0.06
 (2
(2 ); and V, 0.05
 (3
(3 ).
).
The M-O spectra were taken with a xenon lamp and monochromator with a photoelastic modulator that allows for simultaneous recording of the Fa- raday rotation and MCD as a function of frequency. The Mn-doped film was 520 nm thick, which resulted in a noisier spectrum in the MCD, and, hence, the hysteresis loop was obtained in reflection (polar Kerr geometry). For low temperature measurements, the samples were mounted in a cold finger cryostat with a temperature range of 10�C300 K. An electromagnet provided a field of 0.45 T with the cryostat and 0.9 T without the cryostat. Figure 1 presents typical raw data for an undoped ZnO film grown on a c-cut sapphire substrate and a 200-nm thick  thin film sample grown on a similar substrate. The MCD of the pure ZnO sample was dominated by the signal from the sapphire substrate of thickness 0.5 mm. The substrate signal varied linearly with the magnetic field and rather weakly with temperature and originates primarily from the tail of the band edge at 7 eV. The contribution of the magnetic film alone, as shown in Figs. 2 and 4 below, was obtained by subtracting off the pure ZnO/substrate signal.
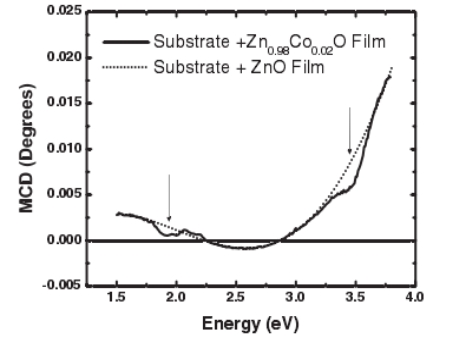
FIG.1.MCD of an undoped ZnO film grown on a c-cut sapphire substrate com- pared to that of a 200 nm film of  grown on a similar sub- strate. Both sets of data were taken at 10 K in a field of 0.45 T. The arrows indicate the d-d transitions at 2 eV and the feature at the ZnO band edge at 3.4 eV for the
  film.
film.
Figure 2 shows the room temperature MCD spectra of ZnO doped with Co (2%),Mn(2%),Ti(2%),and V(5%) together with the absorption spectra for the Mn-, Co-, and V-doped samples, and the Faraday spectrum for the Ti- doped film. The absorption spectrum of the Ti: ZnO was similar to that of V: ZnO .The absorption spectra all show an edge at the band gap, although the Mn spectrum is much steeper than the other three. We shall argue below that this is related to the fact that only the Mn-doped sample showed semi- conducting rather than metallic conductivity at 300 K The sign of the MCD signal at the band edge was the same for all dopants as consistent with an electron mechanism in all cases[11].
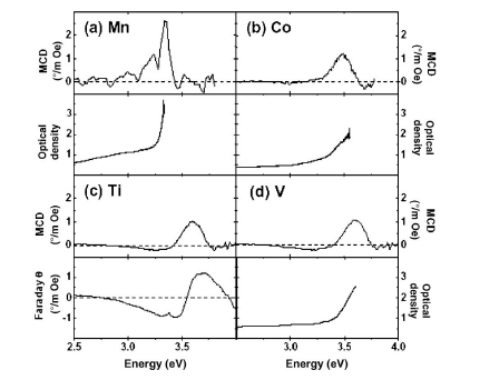
FIG.2.Room temperature MCD measurements of ZnO doped with (a) Mn(2%),(b) Co(2%),(c) Ti(2%),and (d) V(5%). Optical absorption data for the Mn-, Co-,and V-doped films are also shown, together with Faraday rotation data for the Ti-doped film.
The key point to note in the data presented in Fig.2 is that all the MCD spectra show a peak at the band edge. We can compare our data to those obtained for ferromagnetic GaMnAs, where a weak negative feature was ob- served from the band edge to the Fermi energy below the Curie tempera- ture[12].In our case, we have a similar feature but of positive sign.
The ferromagnetic origin of the band edge MCD is confirmed by the ob- servation of open MCD hysteresis loops for the Co-,V-,and Ti-doped films and a Kerr rotation hysteresis loop for Mn. Figure 3 shows the open loops obtained for the doped samples compared to the closed loop for the control pure ZnO film. These results constitute the first observation of open M-O loops for the ZnO band edge transition at room temperature. Previous hysteresis loops were either taken at low temperature[13,14]or showed no resonant signal at the band edge[15]. Coercive fields of  90,
90,  150,
150,  100,and
  180
180 40 Oe were measured for the Mn-, Co-,Ti-,and V-doped samples, respectively, and the values are consistent with those of 100 Oe measured by SQUID magnetometry[1�C3].
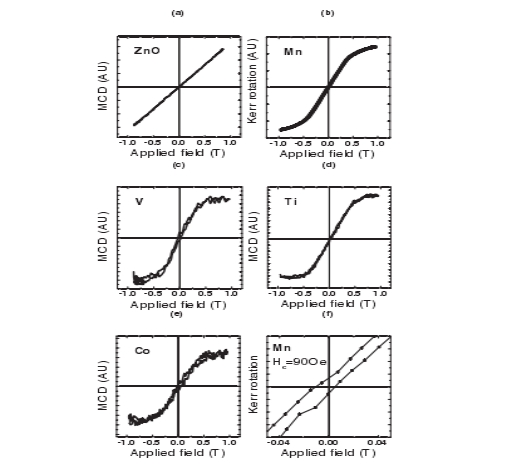
FIG.3.MCD/Kerr hysteresis loops obtained at room temperature and an energy of 3.4 eV.(a) MCD versus field for the pure ZnO film.(b) Kerr rotation versus field for the same Mn-doped film as Fig.2 (a) .(c)�C(e) MCD versus field for the same V-, Ti-, and Co-doped films as Figs.2 (b)�C2 (d).(f) Expanded plot of (b) showing the coercive field. The linear variation of the pure ZnO film shown in (a) has been subtracted from the data and the graphs rescaled accordingly.
The origin of the MCD may be explored in more detail by studying its temperature dependence. Figure 4 presents MCD data for the Mn-and Co-doped samples from 10 K to room temperature. Both samples show a negative excitonic feature at low temperatures that has been observed previously[13].This signal weakens rapidly as the temperature increases, both because of its paramagnetic nature and because the number of carriers increases, leading to exciton screening. The band edge signal at temperatures above 150 K is dominated by the positive feature shown in Fig.2.The fact that the MCD does not show a dependence on 1/T above 100 K is a further indication that it arises from the ferromagnetic component.
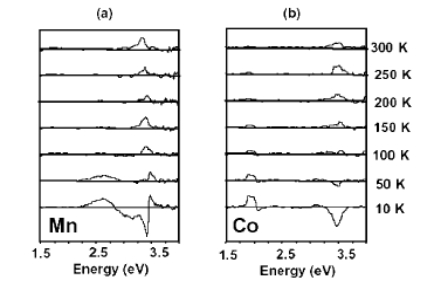
FIG.4.Temperature dependence of the MCD of (a)  and (b)
  .
.
The spectrum of Mn-doped ZnO shows an additional feature at 2.5 eV that is weakened at 50 K and has vanished by 100 K. This appears to correspond either to a minority phase of ,which has a
  of 43 K, or to
  ,which has a transition at 83 K. At higher energy there are some very weak Mn d-d transitions between 2.55 and 3.2 eV [16].At low temperatures, the Co-doped material also shows an additional feature at 2 eV from crystal-field splittings of the Co2 ion[13].
Having presented the data, we can discuss the origin of the band edge features that are observed .We begin by considering the relationship between the MCD and Faraday data presented in Fig.2.The MCD  and Faraday rotation
  at angular frequency
  are proportional to the imaginary and the real parts of the off-diagonal component of the dielectric constants
 ,respectively, and should satisfy a Kramers-Kronig relation. This is seen in all our samples and demonstrated for the Ti-doped film in Fig.2(c).This verifies that the main contribution to the Faraday rotation originates from the same band edge transition that dominates the MCD.
Now let us consider the relationship between the optical data and the free carrier density. The absorption edge of heavily doped semiconductors differs from a pure sample in two ways[17,18].First, the Burnste in-Moss shift due to the extrinsic carriers has the effect of sharpening the absorption edge and raising it to higher energies, according to  and
and  ,where
  is the Fermi energy relative to the bottom of the conduction band,
  is the band gap,
  is the appropriate effective mass, and
  is the Fermi-Dirac function. The subscripts refer to the conduction and valence bands, respectively. Second, the disorder causes band tails to form on both the valence and the conduction bands. In the case of doped ZnO, we are dealing with an n-type material, and
  will therefore lie in the conduction band. Hence, the transitions that are observed to the vacant conduction band states start either from the valence band ail or from valence band states. In these circumstances, one expects an absorption that varies linearly with energy for the valence-tail to conduction-band transitions and then a well-defined absorption plateau at higher energies above the onset for band-to-band transitions as sketched in Fig. 5(a)[17].The spin splitting of the bands shown in Fig.5(b)causes a shift of the absorption plateau for
  and
and  light as indicated in Fig.5(c).We then expect a peak of
width 
 at
at  in the MCD as sketched in Fig.5(d). The optical splitting
  is related to the band splittings
  and
and  by
by  .
.
The schematic behavior depicted in Fig.5 is clearly observed in the experimental data for the Co, V, and Ti samples given in Figs.2 and 4.The carrier densities at room temperature in these samples were determined by Hall measurements to be  for Co,
  for Ti, and
  for V. Thus, in all three cases,
  is considerably larger than
  ,and an MCD peak at the band edge is observed in agreement with Fig.5(d).In principle, the width of the peak should give an estimate of
  .However, the transitions suffer from inhomogeneous broadening, as demonstrated by the broad Co crystal-field transitions at 2 eV. Hence, the observed widths(0.14 eV)give only an upper bound on the exchange splitting.We note that a band splitting of 0.14 eV is actually much larger than would be required to produce room temperature ferromagnetism[6].The data shown in Fig.2 demonstrate that the main MCD peak is related to band-to-band rather than tail-to-band transitions because the peak comes close to the energy where the absorption is saturating rather than to the threshold energy or the tail-state absorption. This transition gives a weak positive MCD because the polarization of the conduction band is positive and the spin-orbit interaction is weak.
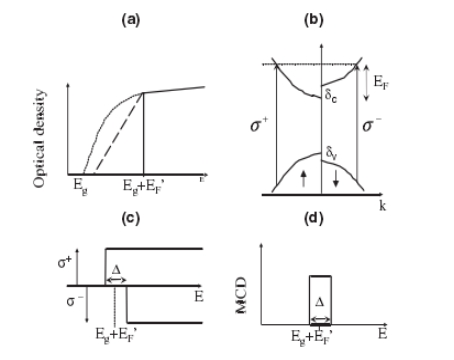
FIG.5.(a)Sketch of the optical density in a nonmagnetic, heavily doped n-type semiconductor. Dotted line: Undoped semiconductor. Dashed-dotted line: Absorption due to transitions from valence band tail states to the conduction band above the Fermi energy  .Solid line: Band-to-band transitions above
  .(b)Spin splitting of the conduction and valence bands, leading to different Fermi momenta and, hence, different energies for
  and
and  transitions to conduction band states at the Fermi energy.(c)Band absorptions from(a)shifted to
  for the opposite polarizations.(d)MCD expected from(c),showing a peak of width
  at
at  .
.
It is apparent from Fig.2 that ZnMnO differs significantly from the other three samples. This difference can be related to its much lower carrier density of  .All the samples were grown under the same conditions, and under these conditions a pure ZnO film should be expected to have a carrier density of
  [4].The much larger carrier densities observed in Co, V, and Ti samples are a consequence of the fact that the conduction band is hybridizing with some of the d electrons of the transition metal dopant. This should be the effect that drives the magnetism in these samples. The low carrier density in the Mn sample may be a consequence of the fact that the Mn d electrons hybridize less strongly with the ZnO conduction band[2,5,11].It is significant to note that ferromagnetism is still observed in the semiconducting Mn sample, with its relatively low density of mobile carriers, which implies that the ferromagnetism can be induced by either localized defect states or band states. The differences in the optical spectra(e.g., the steeper absorption edge)are consistent with the absence of significant band tailing and, hence, the increased importance of band-to-band transitions, as appropriate for the low carrier density.
Finally, we note that the general agreement between the experimental data and the split-band model is good evidence that the ferromagnetism is not related to an impurity phase. Clustering of transition metal dopants would lead to strong antiferromagnetic exchange interactions across the oxygen bond,and this could explain the low magnetic moments observed in our samples. However, we would not then be able to explain the MCD peak at the band edge. Furthermore, we can argue that the ferromagnetism in  is likely to involve only the fraction
of the transition metal M sites that do not have a magnetic neighbor, where z is the number of nearest neighbors. With z 12,values of x < 6% have at least half of the sites free to participate, which explains why low values of x are required.Low temperature processing is also essential to
avoid clustering[1].
In conclusion, the results that we have obtained show unambiguously that the ferromagnetism in doped ZnO causes band splitting in the bulk ZnO lattice. The particularly important features are the following:
(i)The room temperature MCD occurs at the ZnO band edge. A Faraday effect is observed above 3 eV in a region where the ZnO film is still transparent.
(ii)The sign of the MCD spectra indicates that the conduction band is hybridized with the magnetic ions and is spin split.
(iii)The fact that the behavior is similar for different dopants indicates that the ZnO may be driven into a similar ferromagnetic state by different transition elements.(All the observed effects are certainly absent, however, for undoped ZnO.)
(iv)The intensity of the MCD does not fall as the temperature is raised above 150 K.For the first time, open MCD hysteresis loops have been observed associated with the ZnO band edge at room temperature with coercive fields consistent with SQUID measurements.
(v)The Mn-doped sample differs from the other three in several ways:It is semiconducting, there is a narrower band of defect states showing up in the absorption, and the MCD effect itself is the largest by a factor of  2.
2.
(vi)We have shown that the splitting of the band states is independent of whether the magnetism occurs in films that are good conductors or rather poor conductors at room temperature.
We thank Professor Miroslav Kucera for advice and assistance in the early stages of the project, and we acknowledge support from the EPSRC via Grants No.GR/S04352/01 and No.EP/D037581/1.
